
Audio
Working globally
For inquiriesthammasat.pra@gmail.com
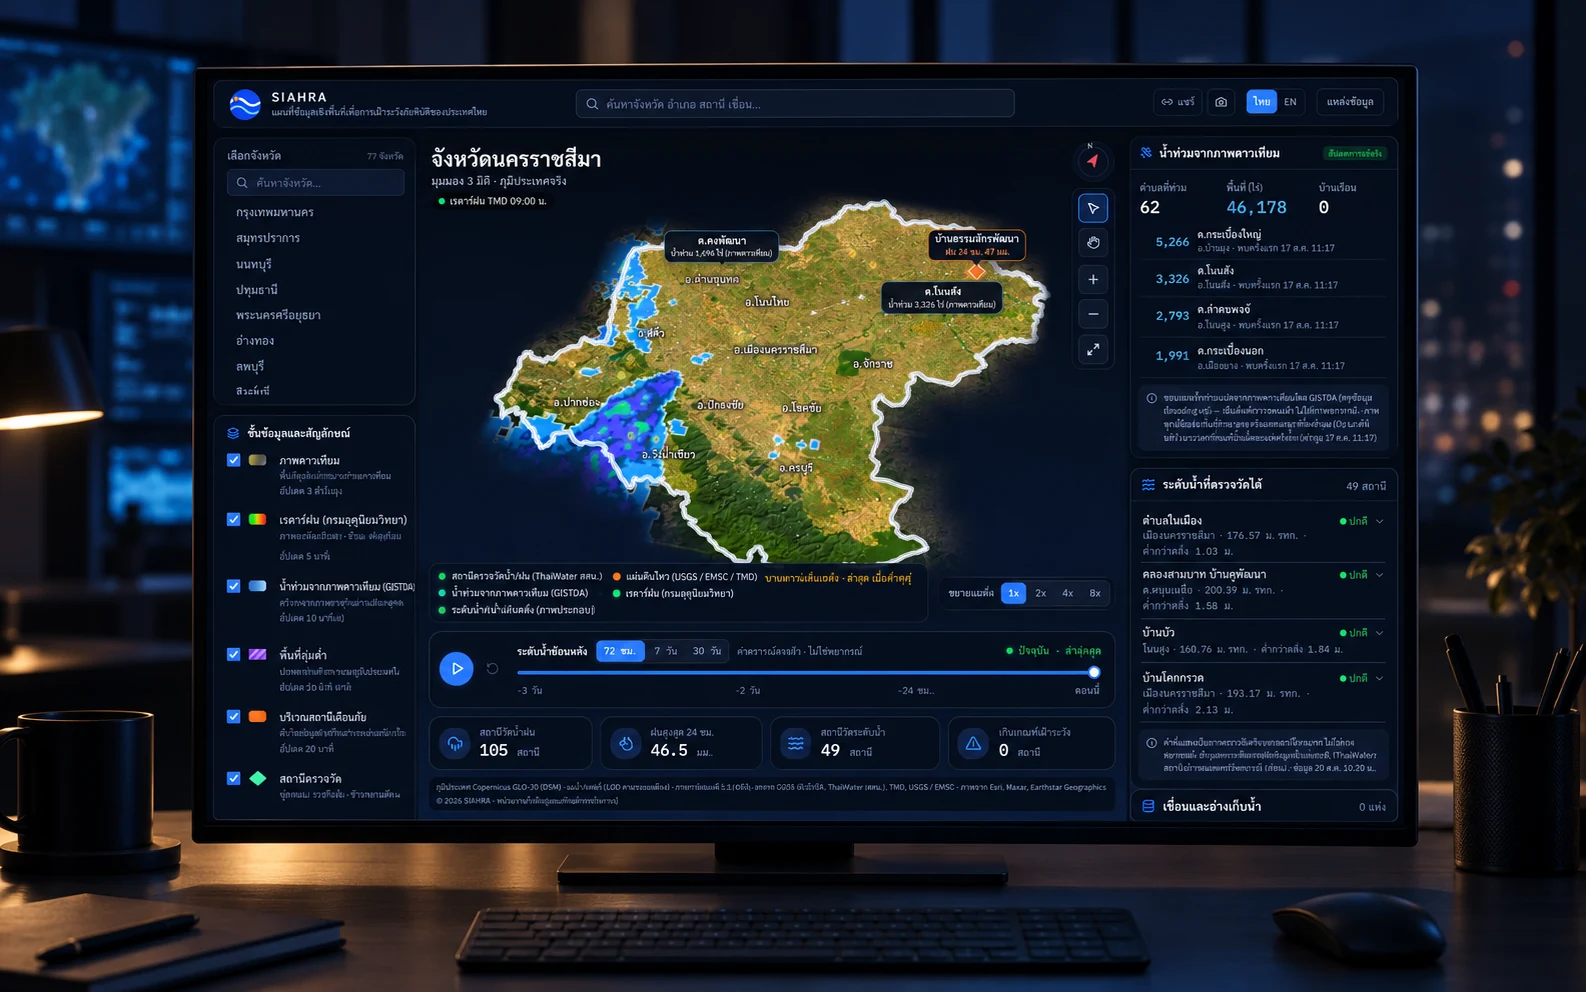

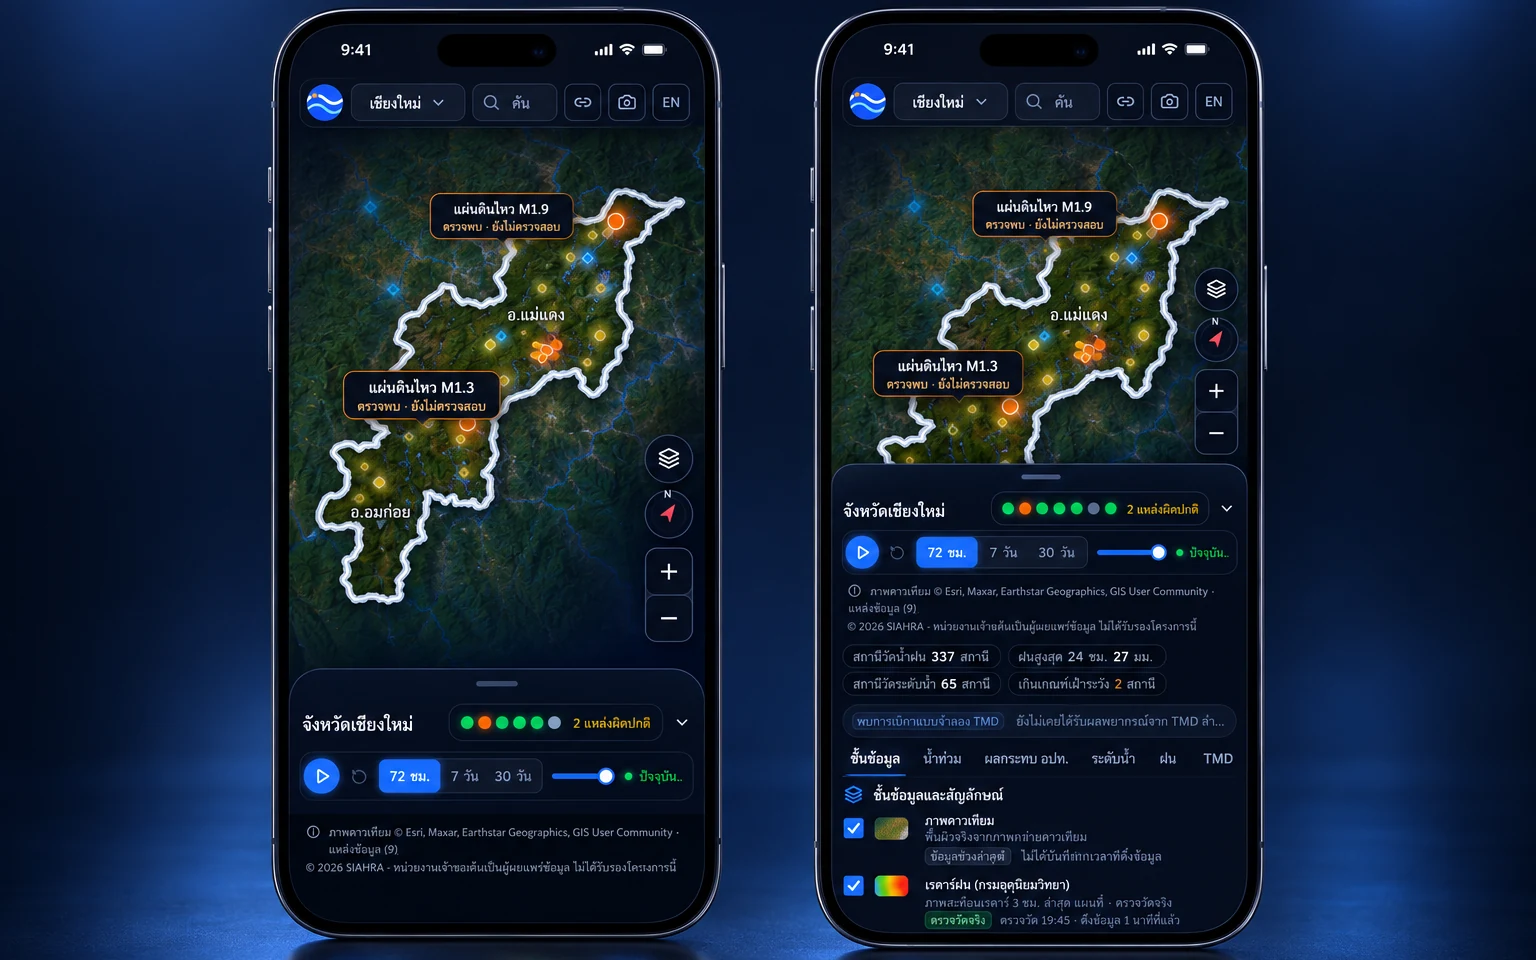
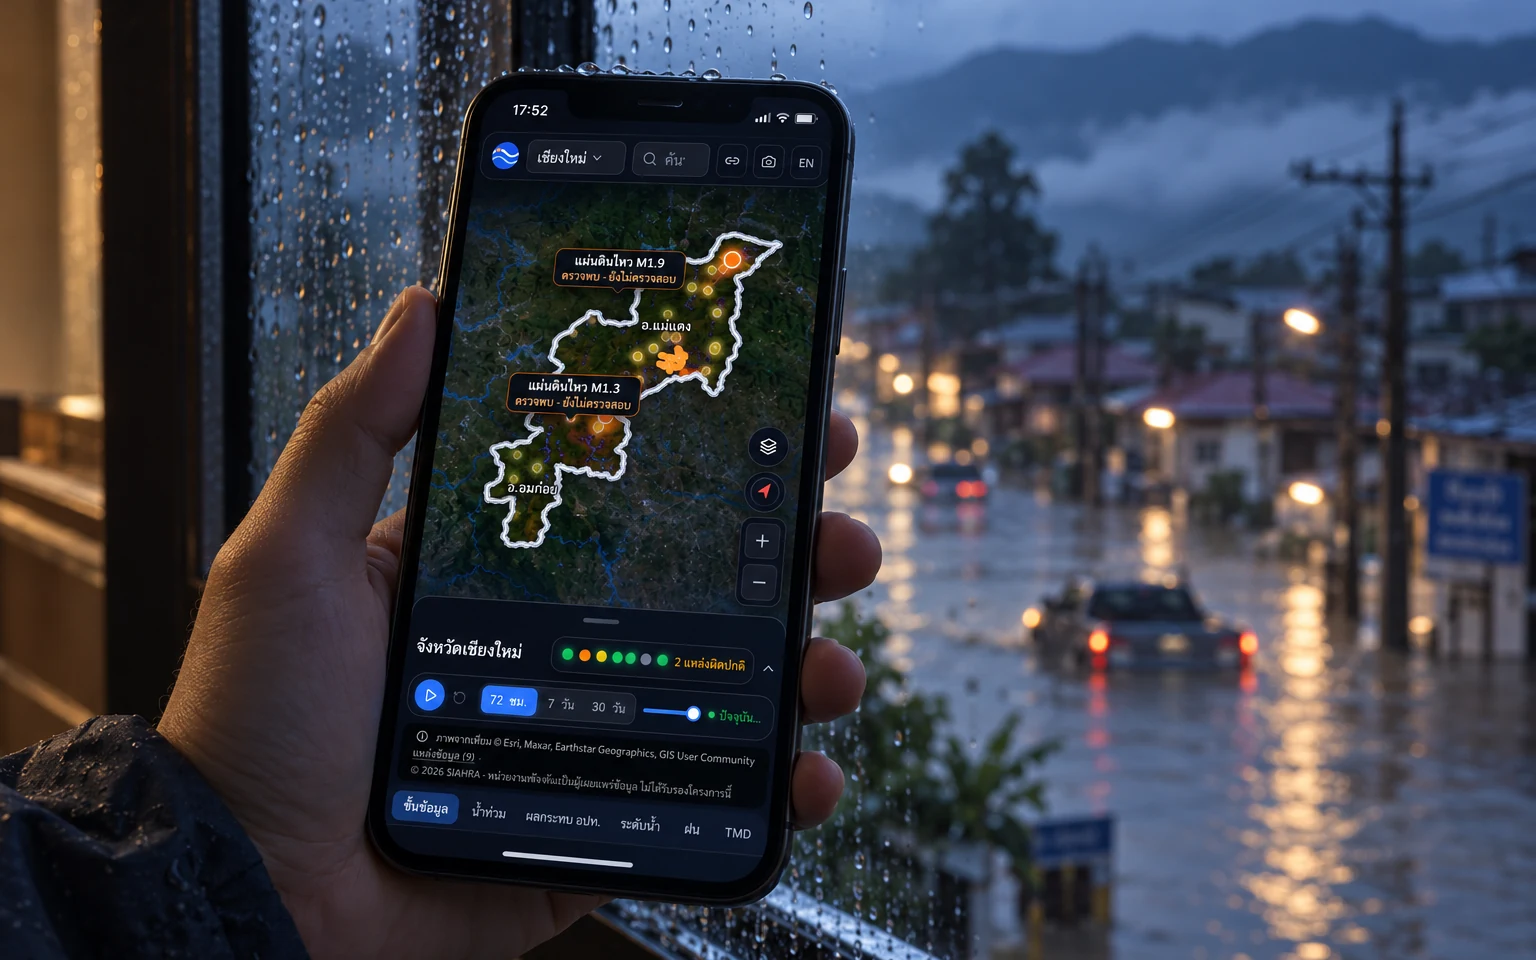
SIAHRA
Fintech · Mobile app03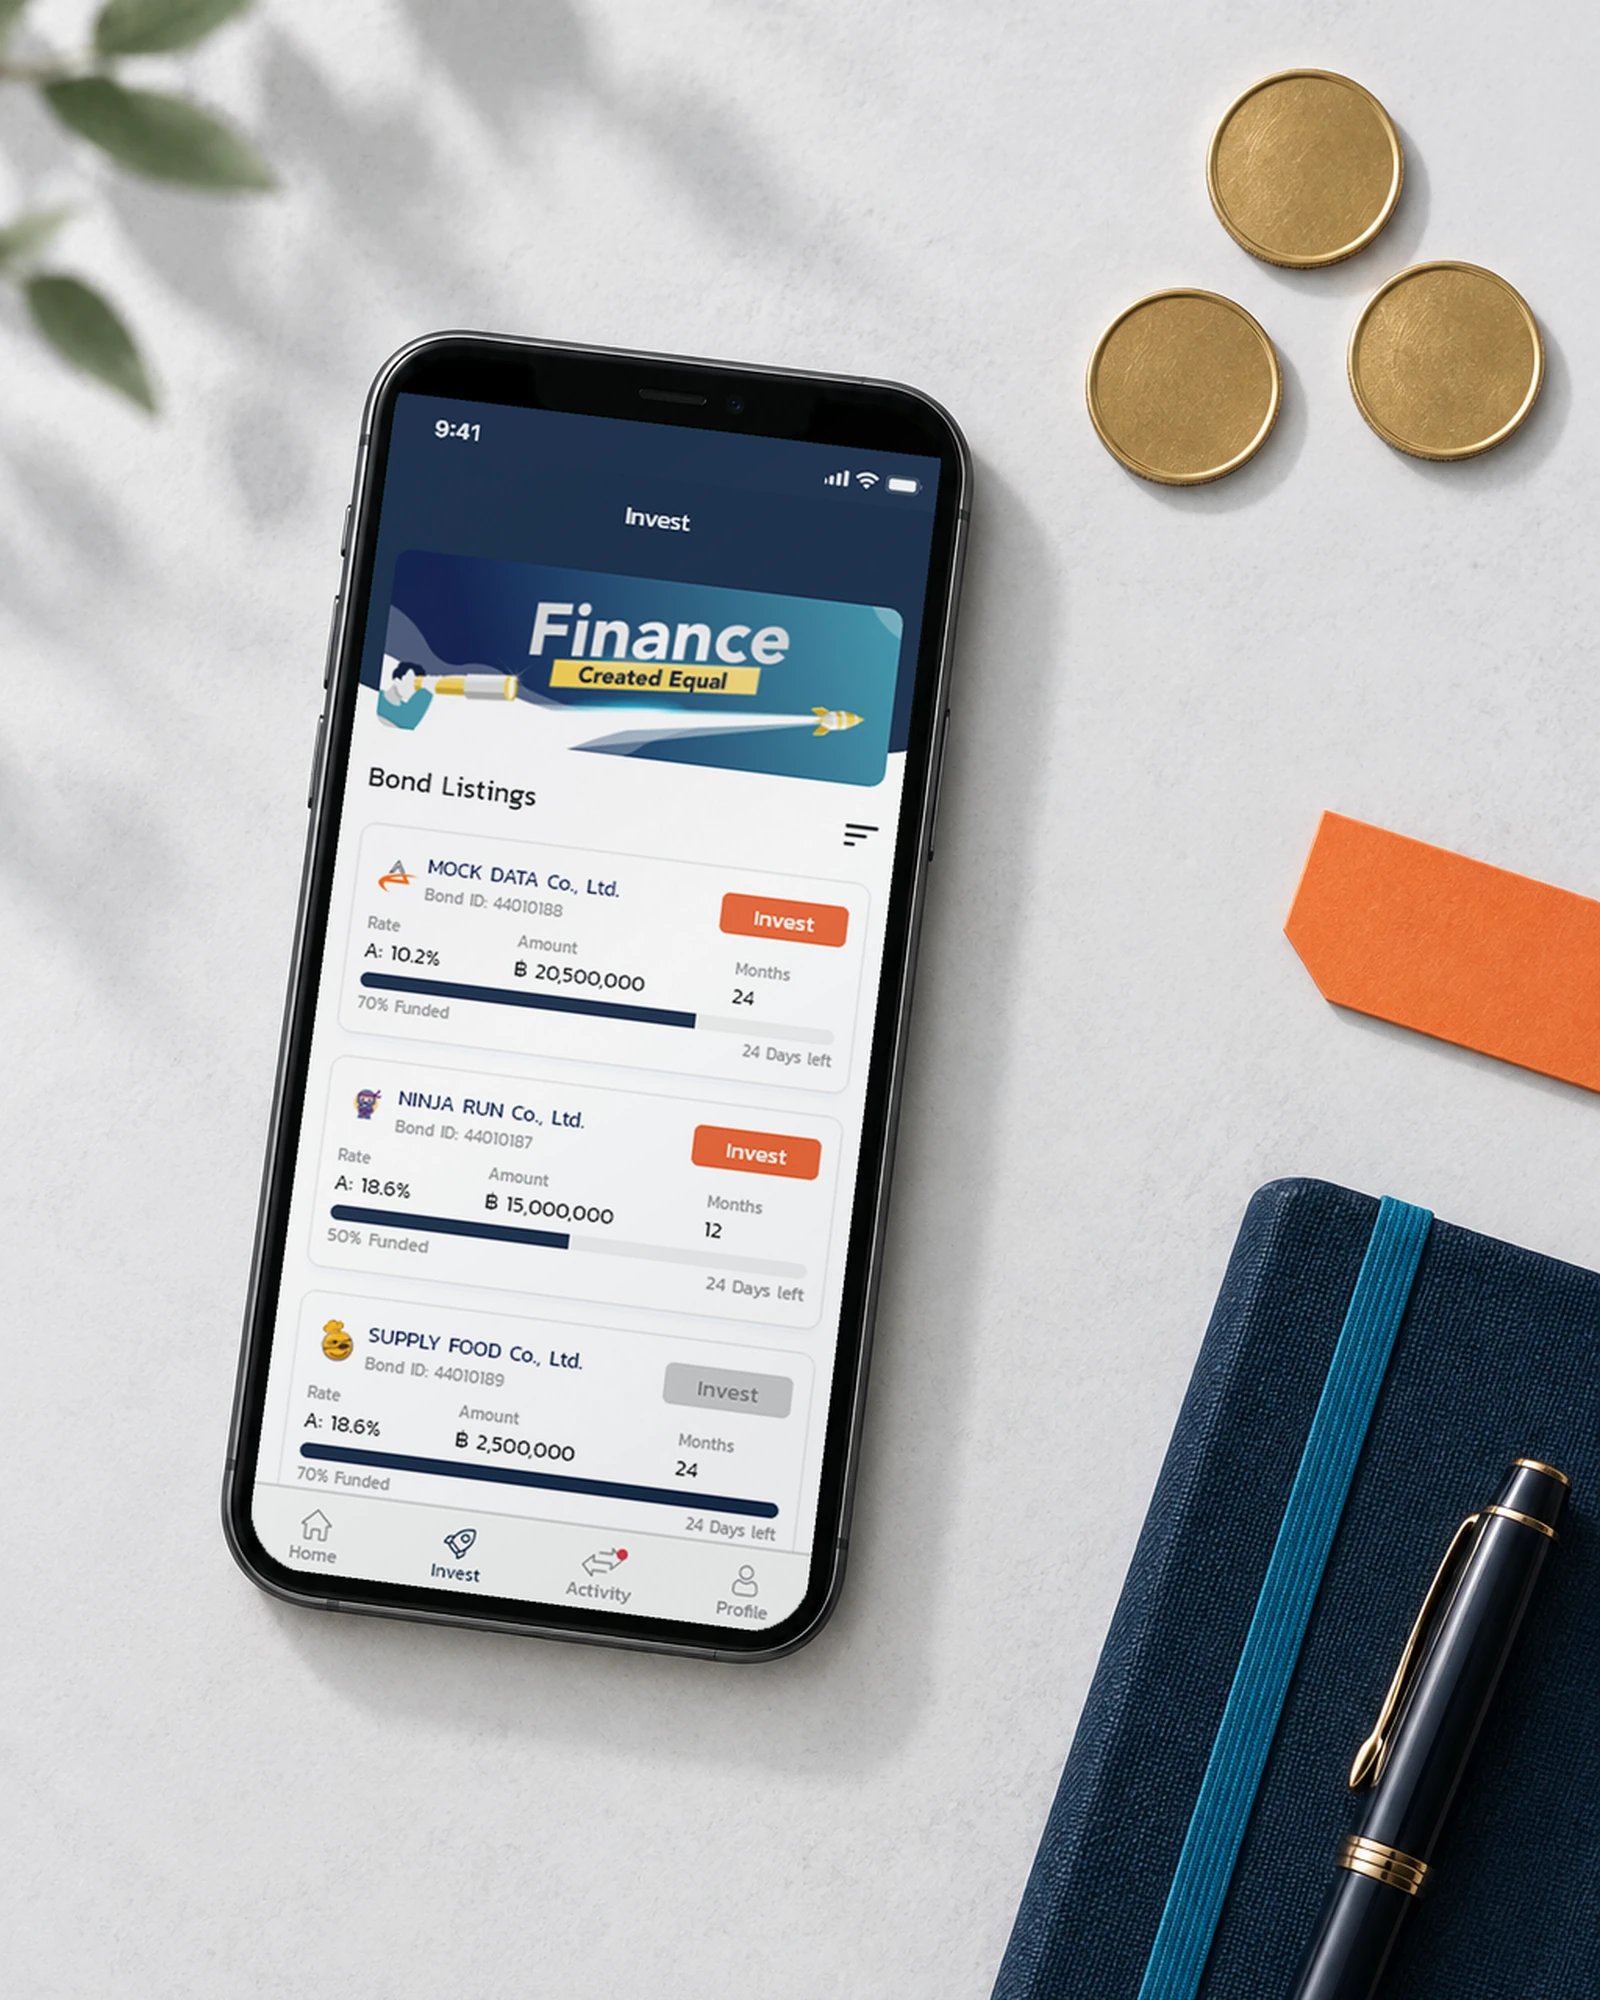
PeerPower
An iOS app for PeerPower's bond investors: pick from the marketplace, invest, and follow every repayment without opening the website.
Insurtech · Mobile app04Emma by AXA
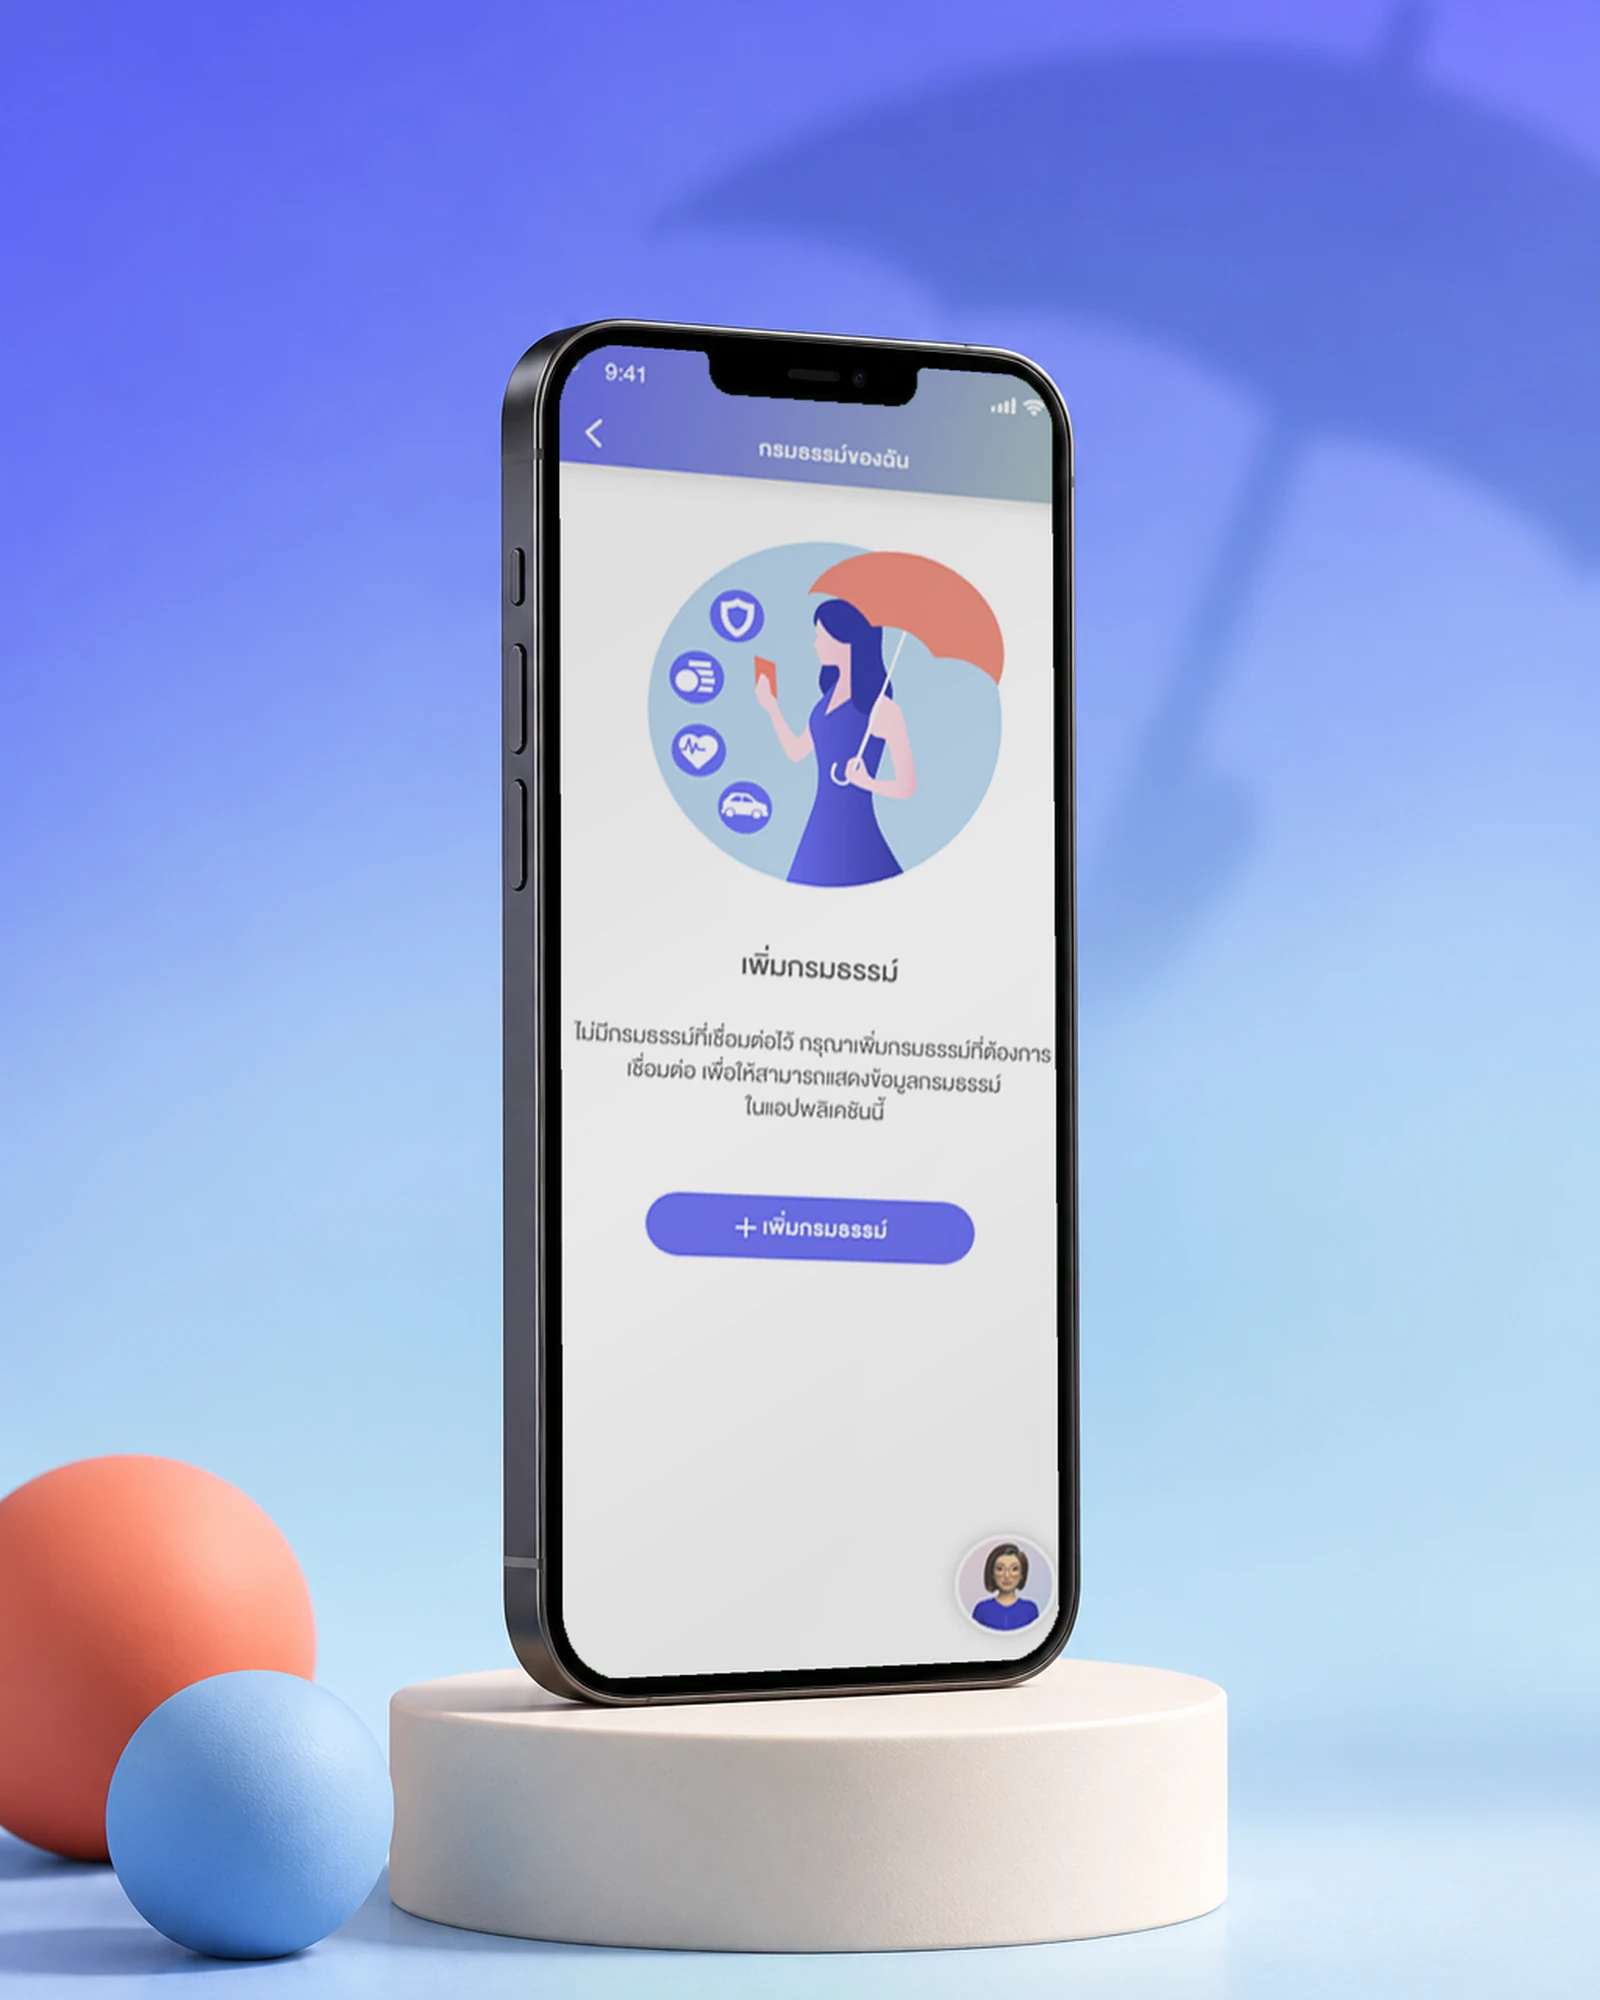
Krungthai-AXA's emma app: policies, insurance cards, network hospitals and TeleHealth, a doctor online, in one place.
Enterprise AI · Mobile app05AXISTANT
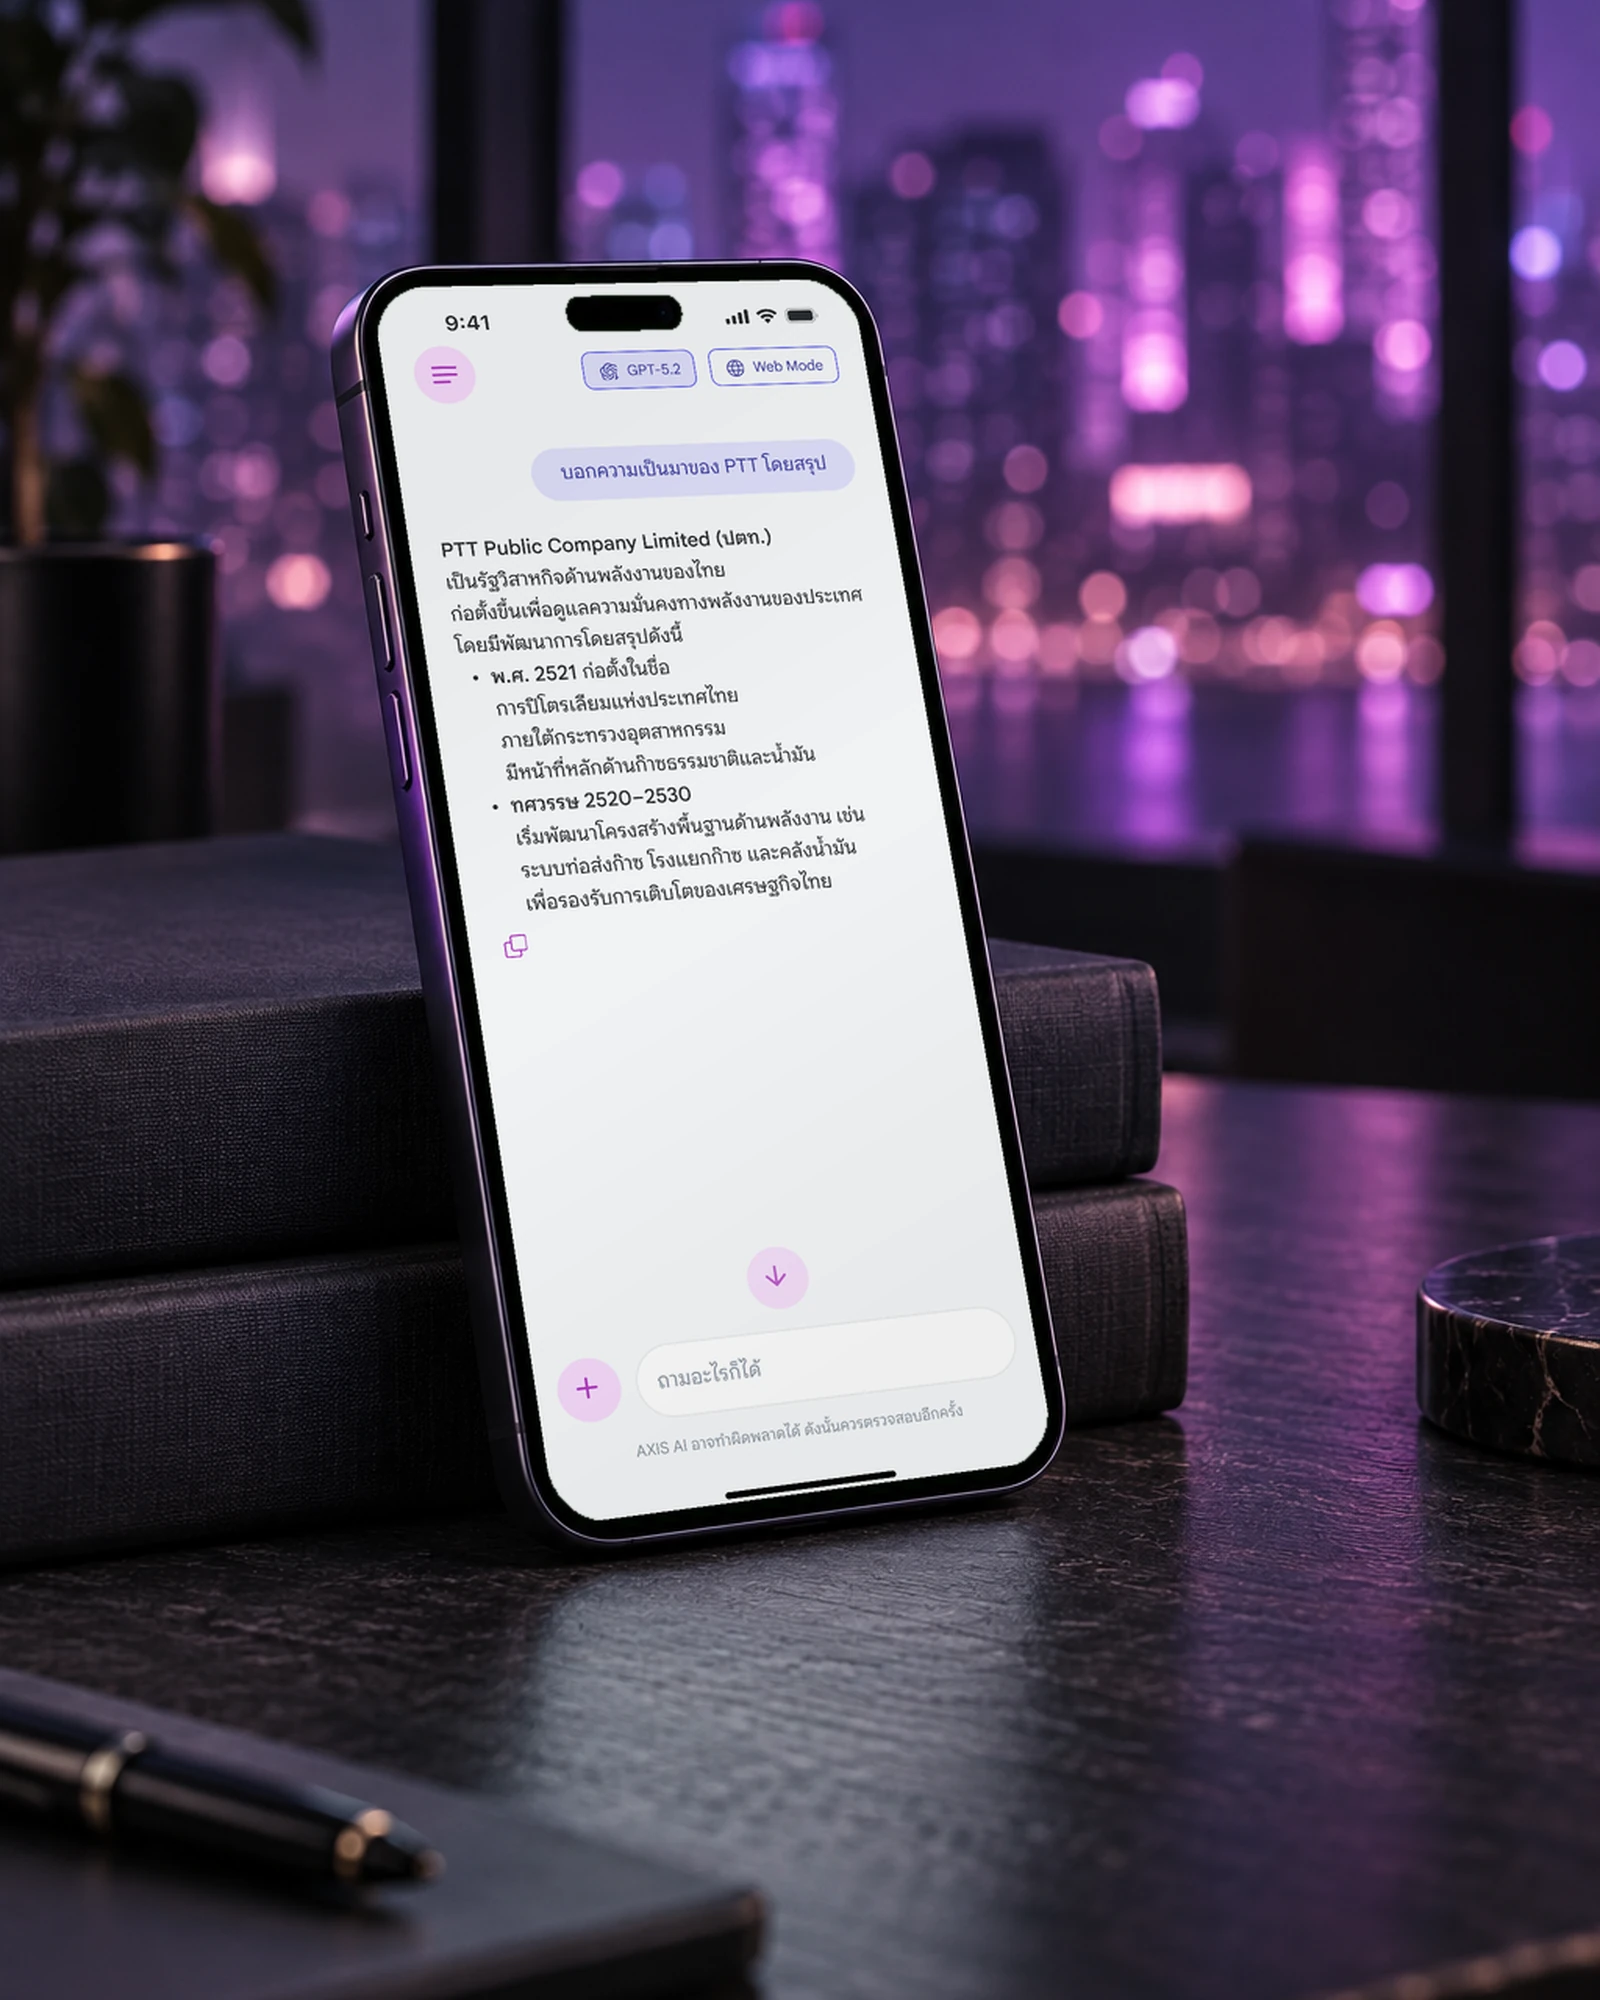
An enterprise AI assistant for an energy company's staff: GPT chat with sources, Deep Research, image generation and files, in Thai.